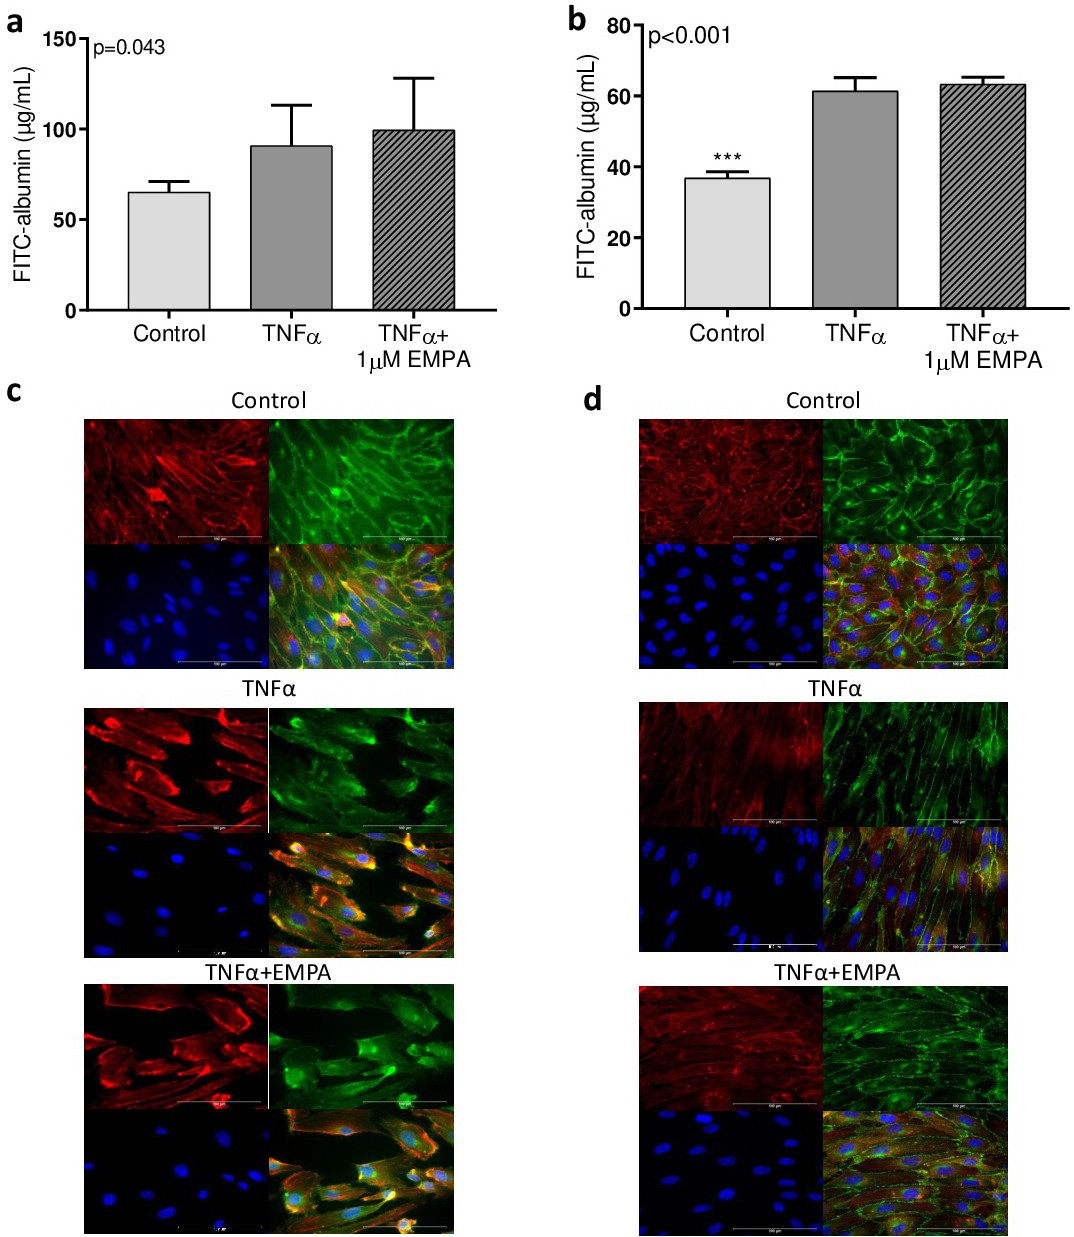
Fig. 7. Endothelial permeability after treatment with TNFα and EMPA. Cells were treated with 0.02% DMSO (control), 10 ng/mL TNFα or with 10 ng/mL TNFα with 1µM EMPA. Permeability was subsequently assessed in a trans-well system by assay of 2h FITC-labelled albumin passage through the HCAECs monolayer (a, n=10 trans-wells/condition from three different cell batches) and the HUVECs monolayer (b, n=4 trans-wells/condition). HCAECs (c) and HUVECs (d) seeded on gelatin-coated coverslips were stained for VE-cadherin (green), actin (red) and DAPI (blue) and subjected to treatment as mentioned above. Scale bars represent 100 µm. Data are presented as mean±SD. ***p<0.001 vs. TNFα.